China’s retail sales of consumer goods grew only 1.1% to CNY 37,000.1 billion in the first nine months of 2026, against 3.7% for all of 2025, the National Bureau of Statistics (NBS) release of 20 October 2026 shows, after the state cut its consumer trade-in subsidy from CNY 300 billion to CNY 250 billion. The Asia Pacific retail and wholesale market covers the gross sales of retail stores and online retailers of goods, excluding catering, plus the sales of wholesale traders that buy and resell goods, across Asia Pacific. Douglas Insights sizes it at USD 34.10 trillion in 2025, USD 10.09 trillion of retail and USD 24.01 trillion of wholesale trade, and at USD 54.21 trillion in 2035, a 4.74% compound annual growth rate (CAGR). The study sits beside our U.S. Retail and Wholesale Market, Asia Pacific IoT in Warehouse Management Market and India Pharmaceutical Drug Market reports inside our consumer goods and retail coverage, and every figure follows the Douglas Insights research methodology.
Which trade type carries the most retail and wholesale value: machinery wholesale, industrial materials wholesale or store-based retail?
Wholesale of machinery, vehicles and electronics carries the most, 25.3% of 2025 value or USD 8.64 trillion, Douglas Insights estimates. Online retail grows fastest, at 7.6% a year to USD 4.73 trillion by 2035.
| Trade type | Share 2025 | Value 2025 | CAGR 2026-2035 | Value 2035 |
|---|---|---|---|---|
| Wholesale of machinery, vehicles and electronics | 25.3% | USD 8.64 trillion | 5.0% | USD 14.08 trillion |
| Wholesale of energy, metals and industrial materials | 23.2% | USD 7.92 trillion | 3.6% | USD 11.28 trillion |
| Store-based retail | 22.9% | USD 7.82 trillion | 3.4% | USD 10.93 trillion |
| Wholesale of food, medicines and consumer goods | 21.8% | USD 7.44 trillion | 5.2% | USD 12.36 trillion |
| Online retail | 6.7% | USD 2.27 trillion | 7.6% | USD 4.73 trillion |
Wholesale makes up 70.4% of the market because goods change hands several times between factory and shop, and because large trading companies resell coal, steel, chemicals and grain between businesses. Machinery, vehicles and electronics lead within wholesale, at about 36% of wholesale value, a Douglas Insights estimate, as factories buy equipment and components through distributors. That trade type grows 5.0% a year, faster than energy, metals and industrial materials at 3.6%, whose volumes follow construction and heavy industry.
Store-based retail, USD 7.82 trillion, grows 3.4% a year as supermarkets, convenience stores and department stores lose share to online sellers. Online retail, USD 2.27 trillion, includes CNY 13,092.3 billion of online sales of physical goods, about USD 1.82 trillion, which grew 5.2% in 2025 and reached 26.1% of retail sales of consumer goods, the NBS release of 20 January 2026 shows; it grows 7.6% a year. Wholesale of food, medicines and consumer goods, USD 7.44 trillion, grows 5.2%. Values for 2035 sum to USD 53.37 trillion, 1.55% below the USD 54.21 trillion headline.
How do retail and wholesale sales split between wholesale and retail trade, and between stores and online selling?
Wholesale trade takes about USD 24.01 trillion, 70.4% of 2025 value, and retail trade USD 10.09 trillion, 29.6%, Douglas Insights estimates. Online sellers take about 22.5% of retail sales of goods.
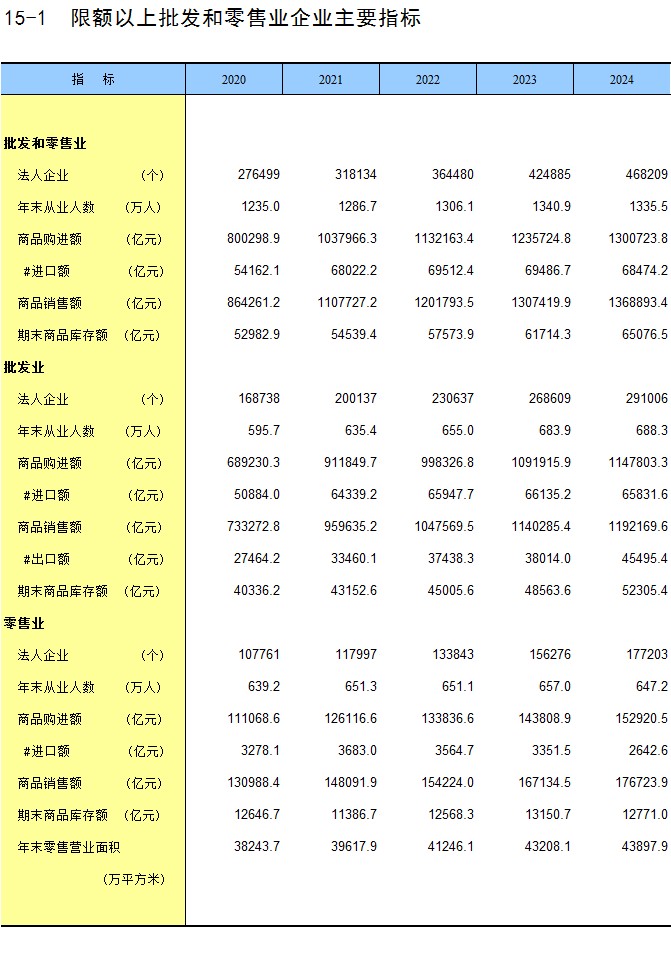
The wholesale-to-retail ratio, about 2.4 to 1, is far higher than in North America because long distributor chains remain common. Japan’s commercial sales reached JPY 634.974 trillion in 2025, of which wholesale JPY 477.463 trillion, up 1.3%, and retail JPY 157.512 trillion, up 1.4%, the Ministry of Economy, Trade and Industry (METI) commercial dynamics survey of 30 January 2026 shows, a ratio of 3.0 to 1. In China, wholesale enterprises above the designated size sold CNY 119.2 trillion in 2024, against CNY 17.7 trillion for retail enterprises above that size, the China Statistical Yearbook 2025 table shows.
By channel, online sales of physical goods made up 26.1% of Chinese retail sales of consumer goods in 2025, and about 25.7% in the first nine months of 2026, by Douglas Insights calculation from the NBS figures of CNY 9,506.0 billion online and CNY 37,000.1 billion total. Across the region we estimate online retail at USD 2.27 trillion, 22.5% of retail sales of goods, rising to about 30% by 2035. By buyer, Douglas Insights estimates that about 35% of wholesale value sells to retailers and the rest to manufacturers, builders, hospitals, restaurants, governments and exporters.
What drives retail and wholesale growth: new stores, online selling, tax cuts or industrial demand?
Real trade volume rises 3.40% a year in our base case, from USD 34.10 trillion at 2025 prices to USD 47.64 trillion in 2035. Four drivers add 4.30 gross points; restraints remove 0.90.
Store expansion in fast-growing economies: 1.10 points
Store expansion is the largest driver, worth 1.10 points. Avenue Supermarts, which runs DMart, lifted standalone revenue 15.9% to Rs 66,968 crore in the year to 31 March 2026 and ended it with 500 stores after adding 85, its results of 2 May 2026 show. Reliance Retail’s gross revenue rose 11.8% to Rs 370,026 crore across 20,160 stores, Reliance Industries’ release of 24 April 2026 shows. Vietnam’s retail sales of goods and services passed VND 7,000 trillion in 2025, up 9.2%, VnEconomy reported on 6 January 2026 from national statistics data.
Online selling: 1.20 points
Online selling adds 1.20 points. Shopee’s gross merchandise value rose 26.8% to USD 127.4 billion in 2025 on 13.9 billion orders, Sea Limited’s results of 3 March 2026 show. Coupang’s net revenues rose 14% to USD 34.5 billion, with product commerce at USD 29.6 billion, its results of 26 February 2026 show, and JD.com’s product revenues rose 10.3% to RMB 1,023.8 billion, its results of 5 March 2026 show. Each point of online share moves about USD 101 billion of yearly retail sales between channels, a Douglas Insights estimate.
Consumption tax cuts: 0.80 points
Tax cuts add 0.80 points. India’s Goods and Services Tax (GST) Council replaced four main rates with two, 5% and 18%, plus 40% for a few luxury goods, from 22 September 2025, the Press Information Bureau states. A shampoo moving from 18% to 5% falls about 11.0% in shelf price and a television moving from 28% to 18% about 7.8%, by Douglas Insights calculation. Japan’s cabinet approved cutting the consumption tax on food from 8% to 1% for two years from April 2027, subject to the Diet, Reuters reported on 5 August 2026.
Industrial and trading demand: 1.20 points
Industrial demand adds the last 1.20 points. Japan’s wholesale sales rose 6.4% to JPY 43.041 trillion in September 2026, against 2.3% for retail, the METI preliminary release of 30 October 2026 shows, and China’s wholesale and retail trade value added rose 5.0% in real terms in 2025, the NBS GDP release of 19 January 2026 shows. Summed, 1.10 + 1.20 + 0.80 + 1.20 = 4.30 points; after 0.90 points of restraints the 3.40% volume leg times the 1.30% price leg gives the 4.74% revenue rate.
What holds back retail and wholesale trade: smaller subsidies, ageing shoppers or export duties?
Three restraints remove 0.90 points a year from real trade growth: smaller consumer subsidies take 0.40 points, ageing and shrinking populations 0.30 points and duties on exports 0.20 points, Douglas Insights estimates.
Smaller subsidies bite first. China funded its 2025 consumer goods trade-in programme with CNY 300 billion of ultra-long special treasury bonds, Xinhua reported on 27 June 2025, and released CNY 250 billion for 2026, the last CNY 62.5 billion batch by 30 September, Guangming Daily reported. China’s retail sales rose only 1.1% in September 2026, to CNY 4,243.3 billion, the NBS October release shows, which is why we take 0.40 points off volume.
Ageing populations take 0.30 points. Japan’s retail sales grew only 1.4% in 2025, the METI survey shows, and South Korea’s 26 major retailers saw offline sales rise only 0.4% while online sales rose 11.8%, Kyunghyang Shinmun reported on 28 January 2026 from Ministry of Trade, Industry and Resources data. Export duties take the last 0.20 points: a 10% United States tariff under Section 122 followed the Supreme Court’s ruling of 20 February 2026 against tariffs under the International Emergency Economic Powers Act (IEEPA), the opinion and a Cozen O’Connor note show, which weighs on export traders.
Where in Asia Pacific do retail and wholesale sales grow fastest: China, India, Japan or Southeast Asia?
China sells the most, about USD 23.33 trillion or 68.4% of 2025 value. India grows fastest, at 9.4% a year to USD 4.54 trillion by 2035, as organised chains and online sellers replace small shops, Douglas Insights estimates.
| Country or sub-region | Value 2025 | Share 2025 | Value 2026 | CAGR 2026-2035 | Value 2035 |
|---|---|---|---|---|---|
| China | USD 23.33 trillion | 68.4% | USD 24.34 trillion | 4.3% | USD 35.55 trillion |
| Japan | USD 4.25 trillion | 12.4% | USD 4.34 trillion | 2.3% | USD 5.33 trillion |
| Southeast Asia | USD 1.90 trillion | 5.6% | USD 2.04 trillion | 7.2% | USD 3.81 trillion |
| India | USD 1.85 trillion | 5.4% | USD 2.02 trillion | 9.4% | USD 4.54 trillion |
| South Korea | USD 1.20 trillion | 3.5% | USD 1.24 trillion | 3.3% | USD 1.66 trillion |
| Australia and New Zealand | USD 773.9 billion | 2.3% | USD 804.9 billion | 4.0% | USD 1.15 trillion |
| Rest of Asia Pacific | USD 800.0 billion | 2.3% | USD 828.8 billion | 3.6% | USD 1.14 trillion |
China’s USD 23.33 trillion combines CNY 44,322.0 billion of retail sales of goods, up 3.8% in 2025 per the NBS January release, and about CNY 123.4 trillion of wholesale sales, a Douglas Insights estimate that grows the yearbook’s CNY 119.2 trillion 2024 figure by 3.5%. Japan, USD 4.25 trillion, converts the METI totals at JPY 149.57 to the dollar, the 2025 average in the Federal Reserve’s G.5A release, and grows 2.3% a year. India, USD 1.85 trillion, and Southeast Asia, USD 1.90 trillion, are Douglas Insights estimates built from store counts, company sales and national retail data such as Vietnam’s 9.2% rise.
South Korea, USD 1.20 trillion, grows 3.3% as online sales rise but offline sales stall. Australia and New Zealand, USD 773.9 billion, combine retail turnover of about AUD 455 billion a year from the Australian Bureau of Statistics’ last Retail Trade release, for June 2025 at AUD 37.9 billion a month, New Zealand retail of about NZD 26 billion a quarter from Stats NZ and an estimated USD 420 billion of wholesale. The Rest of Asia Pacific, led by Taiwan and Hong Kong, grows 3.6%. Country values sum to USD 35.61 trillion in 2026, 0.30% below the headline, and USD 53.17 trillion in 2035, 1.91% below it.
Who sells the most goods, and how fragmented is retail and wholesale trade?
JD.com holds about 0.42% of 2025 trade value, a Douglas Insights estimate, on RMB 1,023.8 billion of product revenue, ahead of AEON at 0.21% and Woolworths Group at 0.14%. The seven companies below hold about 1.1%.
| Company | Trade | Latest filed figure | Estimated share 2025 |
|---|---|---|---|
| JD.com | Online retail | Product revenues RMB 1,023.8 billion, 2025 | 0.42% |
| AEON | Store retail | Operating revenue JPY 10,715.3 billion, FY to February 2026 | 0.21% |
| Woolworths Group | Store retail | Sales AUD 71.5 billion, F26 | 0.14% |
| Reliance Retail | Store and online retail | Gross revenue Rs 370,026 crore, FY2026 | 0.12% |
| Wesfarmers | Store retail | Revenue AUD 47.3 billion, FY2026 | 0.09% |
| Coupang | Online retail | Product commerce USD 29.6 billion, 2025 | 0.09% |
| Avenue Supermarts (DMart) | Store retail | Consolidated revenue Rs 68,821 crore, FY2026 | 0.02% |
AEON’s operating revenue rose 5.7% to JPY 10,715.3 billion in the year to February 2026, its results of 9 April 2026 show, about USD 71.6 billion at the 2025 average rate. Woolworths Group’s sales rose 3.6% to AUD 71.5 billion in the 52 weeks to 28 June 2026, its results of 26 August 2026 show, and Wesfarmers’ revenue rose 3.4% to AUD 47.3 billion, with Bunnings at AUD 20.4 billion, its results of 27 August 2026 show.
Marketplaces are counted through the merchants that sell on them, not their own revenue. Alibaba’s revenue rose 3% to RMB 1,023.7 billion in its year to 31 March 2026, with customer management revenue up 5% to RMB 343.9 billion, its results of 12 May 2026 show, and PDD Holdings’ revenue rose 10% to RMB 431.8 billion in 2025, its results of 25 March 2026 show; both are fees on goods that third-party sellers sell. China alone had 291,006 wholesale enterprises above the designated size in 2024, the yearbook shows, and they, smaller traders and millions of shops share the remaining 98.9%, a Douglas Insights estimate.
How fast do trade prices rise, and what do tax cuts do to shelf prices?
Trade prices rise 1.30% a year in our base case, Douglas Insights estimates, at constant 2025 exchange rates, because Chinese goods prices are flat while Indian, Southeast Asian and Australian prices keep rising.
All values convert at 2025 average rates from the Federal Reserve’s G.5A release: CNY 7.1875, JPY 149.5686, INR 87.1468 and KRW 1,421.40 to the dollar, and USD 0.6450 per Australian dollar. Holding rates fixed keeps the price leg about goods prices. Our 1.30% leg takes the price index from 1.000 in 2025 to about 1.013 in 2026 and 1.138 in 2035.
Tax changes move shelf prices once. India’s GST cut from 28% to 18% lowers the tax-inclusive price of affected goods by about 7.8% and a cut from 12% to 5% by about 6.3%, by Douglas Insights calculation; Japan’s proposed food rate of 1% against 8% would cut food shelf prices by about 6.5% from April 2027. We treat those as level shifts that lift volume rather than lasting changes to the price leg.
What rules govern retail and wholesale trade, from subsidies to sales tax and import duties?
Three policy layers govern trade in the forecast: consumer subsidies such as China’s CNY 250 billion 2026 trade-in programme, sales taxes such as India’s two-rate GST from 22 September 2025, and import duties on goods sold to the United States.
Subsidies set the pace in China. The 2025 trade-in programme was linked to more than CNY 2.6 trillion of sales and more than 360 million purchases, including over 11.5 million cars and 129 million home appliances, the Ministry of Commerce said, gov.cn reported on 1 January 2026. The 2026 programme released its full CNY 250 billion in four quarterly batches, per Guangming Daily.
Taxes set the price. India’s two-rate GST keeps a few tobacco products at old rates until compensation loans are repaid, the Press Information Bureau notes, and Japan’s food tax cut needs approval from the Diet before April 2027. Import duties set export demand: after the Supreme Court ruling, a 10% Section 122 tariff applies for up to 150 days, according to Cozen O’Connor, which keeps exporters and their trading houses uncertain on pricing into 2027.
What if subsidies fade or tax cuts lift demand: how large is the retail and wholesale market in 2035?
The market ends 2035 between USD 43.70 trillion and USD 65.18 trillion across three cases, around a USD 54.21 trillion base. Chinese demand and Indian store growth set most of the spread.
| Case | Volume leg | Price leg | Revenue rate | 2035 value |
|---|---|---|---|---|
| Slower | 2.00% | 0.50% | 2.51% | USD 43.70 trillion |
| Base case | 3.40% | 1.30% | 4.74% | USD 54.21 trillion |
| Faster | 4.60% | 2.00% | 6.69% | USD 65.18 trillion |
In the slower case China ends consumer subsidies after 2026, its retail growth stays near 1% and export duties rise, taking 1.40 points off volume and 0.80 points off price. In the faster case Chinese household spending recovers, India keeps double-digit chain growth and Japan’s food tax cut lifts volumes, adding 1.20 points to volume and 0.70 points to price. One extra point of yearly revenue growth adds about USD 5.40 trillion to 2035 value, and one point less removes about USD 4.96 trillion, Douglas Insights estimates.
Recent data bracket the base case. Japan’s wholesale sales rose 6.4% in September 2026 while China’s retail sales rose 1.1% in the first nine months, the sources above show. Our 4.74% sits between fast-growing Indian and Southeast Asian chains and a Chinese market whose consumer subsidies are shrinking.
Douglas Exclusive: the Trade-in Leverage Ledger
The Trade-in Leverage Ledger is a Douglas Insights model built from 10 inputs: 8 government statistics, policy documents or official news reports and 2 company filings. It measures the sales linked to each yuan of consumer subsidy.
| Date | Input | What it moves |
|---|---|---|
| 27 June 2025 | CNY 300 billion trade-in funding for 2025 | Subsidy pool |
| 22 September 2025 | Two-rate GST takes effect | Indian prices |
| 1 January 2026 | Trade-in linked to over CNY 2.6 trillion of sales | Subsidised sales |
| 19 January 2026 | Trade value added up 5.0% | Real trade growth |
| 20 January 2026 | 2025 retail sales CNY 50,120.2 billion | Retail base |
| 5 March 2026 | JD.com product revenues up 10.3% | Online volume |
| 12 May 2026 | Alibaba customer management revenue up 5% | Marketplace volume |
| 30 September 2026 | Full CNY 250 billion for 2026 released | Subsidy pool |
| 20 October 2026 | Retail sales up 1.1% in nine months | Retail growth |
| 30 October 2026 | Japanese wholesale up 6.4% in September | Wholesale growth |
The finding, a Douglas Insights estimate: each yuan of the 2025 subsidy was linked to about CNY 8.67 of sales, and those CNY 2.6 trillion equal 5.2% of 2025 retail sales of consumer goods. At the same ratio the smaller 2026 pool supports about CNY 2.17 trillion, CNY 0.43 trillion less, or about 0.86% of 2025 retail sales, roughly a third of the fall in Chinese retail growth from 3.7% to 1.1%.
The ledger changes how to read 2027. If Beijing holds the programme at CNY 250 billion, the drag fades and Chinese retail growth returns toward 3%; if it ends the programme, a further CNY 2.17 trillion of linked sales is at risk, close to 4.3% of the retail base, and the slower case comes into view.
How does the methodology turn USD 10.09 trillion of retail and USD 24.01 trillion of wholesale into a forecast?
How this report is built
- Every figure carries a confidence grade in the fact sheet above, and the working model ships with every licence.
- Seven regional models sum to the global figure, with country tables in the Excel model.
- The next scheduled review of this study is May 2027.
- Licence holders receive it as a maintained tab in the Excel model.
Our methodology adds 2025 retail sales of goods, USD 10,093.5 billion, to wholesale sales, USD 24,009.5 billion, to reach USD 34,103.1 billion at 2025 exchange rates, then grows real volume 3.40% and prices 1.30% a year.
The model covers 5 trade types, 2 trades, 2 channels and 7 countries or sub-regions, using 72 data points, 30 sourced and 42 modelled. China and Japan come from NBS, the China Statistical Yearbook and METI; other countries combine statistics releases, company sales and store counts, all Douglas Insights estimates where no national total exists. Arithmetic: USD 34,103.1 billion x (1.0340 x 1.0130)^10 = USD 54,211.7 billion, the USD 54.21 trillion headline; 2026 is USD 35,721.0 billion.
Two cross-checks agree. First, Japan’s 3.0 to 1 wholesale-to-retail ratio from METI and China’s 6.7 to 1 ratio for enterprises above the designated size both sit above our regional 2.4 to 1, as they should, because our total also counts small shops below the size threshold and smaller economies with shorter supply chains. Second, JD.com’s USD 142.4 billion of product revenue at CNY 7.1875 equals about 6.3% of our online retail line, in line with its place behind marketplace sellers. AI tools help draft the text and automated checks test the arithmetic and links; the Douglas Insights research desk chooses the sources, builds the model and approves publication, as our editorial standards explain.
Sources
- National Bureau of Statistics of China National economy, September 2026: retail sales (2026)
- National Bureau of Statistics of China National economy 2025: retail and online sales (2026)
- National Bureau of Statistics of China China Statistical Yearbook 2025, table 15-1 (2025)
- Ministry of Economy, Trade and Industry, Japan Commercial Dynamics Statistics, 2025 (2026)
- Ministry of Economy, Trade and Industry, Japan Commercial Dynamics Statistics, September 2026 (2026)
- Press Information Bureau, India GST Council 56th meeting: two-rate structure (2025)
- gov.cn (Ministry of Commerce) 2025 trade-in programme results (2026)
- Federal Reserve Board Foreign exchange rates, annual 2025 (G.5A) (2026)
- JD.com JD.com 2025 results (2026)
- Woolworths Group (ASX) Woolworths Group F26 results (2026)
- Reliance Industries Reliance Industries Q4 FY2025-26 release (2026)
- Coupang Coupang fourth quarter 2025 results (2026)
What counts in the retail and wholesale study, and what is excluded?
The study counts gross sales of goods by retail stores, online retailers and wholesale traders, at the prices they charge, converted at 2025 average exchange rates. Catering, services, marketplace fees and manufacturers’ own sales offices are excluded.
Because wholesalers sell part of their goods to retailers, the total measures trade turnover rather than final demand; Douglas Insights estimates the overlap at about USD 8.40 trillion, 35% of wholesale sales. Catering revenue, CNY 5,798.2 billion in China in 2025, is excluded, as are fuel taxes collected separately. Warehouse technology appears in our Asia Pacific IoT in Warehouse Management Market report, the North American comparison in our U.S. Retail and Wholesale Market study and Indian medicine spending in our India Pharmaceutical Drug Market report.
Inside the report
01Executive summary12 sections
The market in one view
- 1.1Market snapshot, 2025 and 2035
- 1.1.1Market size, 2025
- 1.1.2Forecast, 2035
- 1.1.3Growth rate, 2026–2035
- 1.2Growth decomposition
- 1.2.1Volume growth (USD billion at 2025 prices)
- 1.2.2Value per unit growth
- 1.3Key findings
- 1.4Segment highlights
- 1.5Regional highlights
- 1.6Competitive highlights
- 1.7Douglas Insights verdict
02Scope and definitions19 sections
What counts and what is excluded
- 2.1Market definition
- 2.2Inclusions and exclusions
- 2.2.1Trade types
- 2.2.2Overlap
- 2.2.3Exclusions
- 2.3Segmentation
- 2.3.1By trade type
- 2.3.2By trade
- 2.3.3By channel
- 2.3.4By buyer
- 2.3.5By country
- 2.3.6By region
- 2.4Years considered
- 2.4.1Base year 2025
- 2.4.2Forecast 2026–2035
- 2.5Currency and units
- 2.5.1Value in USD million
- 2.5.2Volume in USD billion at 2025 prices
- 2.6Who this report is for
03Research methodology16 sections
Bottom-up: USD billion at 2025 prices × value per unit
- 3.1Bottom-up market model
- 3.1.1Volume base, 2025 (USD billion at 2025 prices)
- 3.1.2Value per unit
- 3.1.3Forecast legs to 2035
- 3.2Top-down cross-checks
- 3.3Data triangulation
- 3.4Sources
- 3.4.1Regulators and statistics offices
- 3.4.2Company filings and results
- 3.4.3Trade and industry bodies
- 3.4.412 primary sources cited
- 3.5Confidence grading
- 3.6Assumptions and limitations
- 3.6.1Inputs
- 3.6.2Arithmetic
- 3.6.3Cross-checks
04Demand drivers4 sections
The 4.30-point gross volume leg
- 4.1Store expansion
- 4.2Online selling
- 4.3Tax cuts
- 4.4Industrial demand
05Restraints3 sections
Points removed from volume
- 5.1Subsidies
- 5.2Ageing
- 5.3Export duties
06Countries3 sections
Seven country and sub-region models
- 6.1China
- 6.2Japan
- 6.3India
07Pricing3 sections
Trade price index
- 7.1Exchange rates
- 7.2Price leg
- 7.3Tax cuts
08Regulation3 sections
Subsidies, sales tax and duties
- 8.1Trade-in
- 8.2GST and food tax
- 8.3Import duties
09Market size and forecast, 2025–20355 sections
Global value, volume and value per unit
- 9.1Market value, 2025–2035
- 9.2Volume (USD billion at 2025 prices), 2025–2035
- 9.3Value per unit, 2025–2035
- 9.4Year-on-year growth
- 9.5Growth decomposition
10Asia Pacific Retail and Wholesale market, by trade type25 sections
8 segments, value 2025–2035
- 10.1Overview and share, 2025 and 2035
- 10.2Wholesale of machinery
- 10.2.1Market size and forecast, 2025–2035
- 10.2.2Growth outlook
- 10.3Vehicles and electronics
- 10.3.1Market size and forecast, 2025–2035
- 10.3.2Growth outlook
- 10.4Wholesale of energy
- 10.4.1Market size and forecast, 2025–2035
- 10.4.2Growth outlook
- 10.5Metals and industrial materials
- 10.5.1Market size and forecast, 2025–2035
- 10.5.2Growth outlook
- 10.6Store-based retail
- 10.6.1Market size and forecast, 2025–2035
- 10.6.2Growth outlook
- 10.7Wholesale of food
- 10.7.1Market size and forecast, 2025–2035
- 10.7.2Growth outlook
- 10.8Medicines and consumer goods
- 10.8.1Market size and forecast, 2025–2035
- 10.8.2Growth outlook
- 10.9Online retail
- 10.9.1Market size and forecast, 2025–2035
- 10.9.2Growth outlook
11Asia Pacific Retail and Wholesale market, by trade7 sections
2 segments, value 2025–2035
- 11.1Overview and share, 2025 and 2035
- 11.2Wholesale trade
- 11.2.1Market size and forecast, 2025–2035
- 11.2.2Growth outlook
- 11.3Retail trade
- 11.3.1Market size and forecast, 2025–2035
- 11.3.2Growth outlook
12Asia Pacific Retail and Wholesale market, by channel7 sections
2 segments, value 2025–2035
- 12.1Overview and share, 2025 and 2035
- 12.2Store-based
- 12.2.1Market size and forecast, 2025–2035
- 12.2.2Growth outlook
- 12.3Online
- 12.3.1Market size and forecast, 2025–2035
- 12.3.2Growth outlook
13Asia Pacific Retail and Wholesale market, by buyer7 sections
2 segments, value 2025–2035
- 13.1Overview and share, 2025 and 2035
- 13.2Retailers
- 13.2.1Market size and forecast, 2025–2035
- 13.2.2Growth outlook
- 13.3Businesses and other buyers
- 13.3.1Market size and forecast, 2025–2035
- 13.3.2Growth outlook
14Asia Pacific Retail and Wholesale market, by country22 sections
7 segments, value 2025–2035
- 14.1Overview and share, 2025 and 2035
- 14.2China
- 14.2.1Market size and forecast, 2025–2035
- 14.2.2Growth outlook
- 14.3Japan
- 14.3.1Market size and forecast, 2025–2035
- 14.3.2Growth outlook
- 14.4Southeast Asia
- 14.4.1Market size and forecast, 2025–2035
- 14.4.2Growth outlook
- 14.5India
- 14.5.1Market size and forecast, 2025–2035
- 14.5.2Growth outlook
- 14.6South Korea
- 14.6.1Market size and forecast, 2025–2035
- 14.6.2Growth outlook
- 14.7Australia and New Zealand
- 14.7.1Market size and forecast, 2025–2035
- 14.7.2Growth outlook
- 14.8Rest of Asia Pacific
- 14.8.1Market size and forecast, 2025–2035
- 14.8.2Growth outlook
15Regional analysis50 sections
7 regions
- 15.1Regional overview and share, 2025 and 2035
- 15.2China
- 15.2.1Market size and forecast, 2025–2035
- 15.2.2By trade type
- 15.2.3By trade
- 15.2.4By channel
- 15.2.5By buyer
- 15.2.6By country
- 15.3Japan
- 15.3.1Market size and forecast, 2025–2035
- 15.3.2By trade type
- 15.3.3By trade
- 15.3.4By channel
- 15.3.5By buyer
- 15.3.6By country
- 15.4Southeast Asia
- 15.4.1Market size and forecast, 2025–2035
- 15.4.2By trade type
- 15.4.3By trade
- 15.4.4By channel
- 15.4.5By buyer
- 15.4.6By country
- 15.5India
- 15.5.1Market size and forecast, 2025–2035
- 15.5.2By trade type
- 15.5.3By trade
- 15.5.4By channel
- 15.5.5By buyer
- 15.5.6By country
- 15.6South Korea
- 15.6.1Market size and forecast, 2025–2035
- 15.6.2By trade type
- 15.6.3By trade
- 15.6.4By channel
- 15.6.5By buyer
- 15.6.6By country
- 15.7Australia and New Zealand
- 15.7.1Market size and forecast, 2025–2035
- 15.7.2By trade type
- 15.7.3By trade
- 15.7.4By channel
- 15.7.5By buyer
- 15.7.6By country
- 15.8Rest of Asia Pacific
- 15.8.1Market size and forecast, 2025–2035
- 15.8.2By trade type
- 15.8.3By trade
- 15.8.4By channel
- 15.8.5By buyer
- 15.8.6By country
16Competitive landscape13 sections
9 companies profiled
- 16.1Market concentration
- 16.2Market share analysis, 2025
- 16.3Strategic moves: acquisitions, launches, contracts
- 16.4Company profilesEach profile: overview, products, financials where reported, position in this market, recent developments
- 16.4.1JD.com
- 16.4.2AEON
- 16.4.3Marketplaces
- 16.4.4About 0
- 16.4.5Woolworths Group
- 16.4.6Reliance Retail
- 16.4.7Wesfarmers
- 16.4.8Coupang
- 16.4.9Avenue Supermarts
17Scenarios to 20355 sections
Slower, base and faster
- 17.1Slower case
- 17.2Base case case
- 17.3Faster case
- 17.4Sensitivity of the 2035 value
- 17.5Published forecasts compared
18Douglas Exclusive: the Trade-in Leverage Ledger3 sections
Sales per yuan of subsidy
- 18.1Ledger
- 18.2Finding
- 18.3Reading 2027
19Appendix5 sections
Data, sources and licence
- 19.1Data tables (Excel model)
- 19.2Sources (12)
- 19.3Abbreviations
- 19.4Change log and next review
- 19.5Licence and how to cite
TList of tables68
- Table 1Market value, 2025–2035 (USD million)
- Table 2Volume, 2025–2035 (USD billion at 2025 prices)
- Table 3Value per unit, 2025–2035
- Table 4Asia Pacific Retail and Wholesale market by trade type, 2025–2035 (USD million)
- Table 5Wholesale of machinery: market size, 2025–2035 (USD million)
- Table 6Vehicles and electronics: market size, 2025–2035 (USD million)
- Table 7Wholesale of energy: market size, 2025–2035 (USD million)
- Table 8Metals and industrial materials: market size, 2025–2035 (USD million)
- Table 9Store-based retail: market size, 2025–2035 (USD million)
- Table 10Wholesale of food: market size, 2025–2035 (USD million)
- Table 11Medicines and consumer goods: market size, 2025–2035 (USD million)
- Table 12Online retail: market size, 2025–2035 (USD million)
- Table 13Asia Pacific Retail and Wholesale market by trade, 2025–2035 (USD million)
- Table 14Wholesale trade: market size, 2025–2035 (USD million)
- Table 15Retail trade: market size, 2025–2035 (USD million)
- Table 16Asia Pacific Retail and Wholesale market by channel, 2025–2035 (USD million)
- Table 17Store-based: market size, 2025–2035 (USD million)
- Table 18Online: market size, 2025–2035 (USD million)
- Table 19Asia Pacific Retail and Wholesale market by buyer, 2025–2035 (USD million)
- Table 20Retailers: market size, 2025–2035 (USD million)
- Table 21Businesses and other buyers: market size, 2025–2035 (USD million)
- Table 22Asia Pacific Retail and Wholesale market by country, 2025–2035 (USD million)
- Table 23China: market size, 2025–2035 (USD million)
- Table 24Japan: market size, 2025–2035 (USD million)
- Table 25Southeast Asia: market size, 2025–2035 (USD million)
- Table 26India: market size, 2025–2035 (USD million)
- Table 27South Korea: market size, 2025–2035 (USD million)
- Table 28Australia and New Zealand: market size, 2025–2035 (USD million)
- Table 29Rest of Asia Pacific: market size, 2025–2035 (USD million)
- Table 30Asia Pacific Retail and Wholesale market by region, 2025–2035 (USD million)
- Table 31China: market by trade type, 2025–2035 (USD million)
- Table 32China: market by trade, 2025–2035 (USD million)
- Table 33China: market by channel, 2025–2035 (USD million)
- Table 34China: market by buyer, 2025–2035 (USD million)
- Table 35China: market by country, 2025–2035 (USD million)
- Table 36Japan: market by trade type, 2025–2035 (USD million)
- Table 37Japan: market by trade, 2025–2035 (USD million)
- Table 38Japan: market by channel, 2025–2035 (USD million)
- Table 39Japan: market by buyer, 2025–2035 (USD million)
- Table 40Japan: market by country, 2025–2035 (USD million)
- Table 41Southeast Asia: market by trade type, 2025–2035 (USD million)
- Table 42Southeast Asia: market by trade, 2025–2035 (USD million)
- Table 43Southeast Asia: market by channel, 2025–2035 (USD million)
- Table 44Southeast Asia: market by buyer, 2025–2035 (USD million)
- Table 45Southeast Asia: market by country, 2025–2035 (USD million)
- Table 46India: market by trade type, 2025–2035 (USD million)
- Table 47India: market by trade, 2025–2035 (USD million)
- Table 48India: market by channel, 2025–2035 (USD million)
- Table 49India: market by buyer, 2025–2035 (USD million)
- Table 50India: market by country, 2025–2035 (USD million)
- Table 51South Korea: market by trade type, 2025–2035 (USD million)
- Table 52South Korea: market by trade, 2025–2035 (USD million)
- Table 53South Korea: market by channel, 2025–2035 (USD million)
- Table 54South Korea: market by buyer, 2025–2035 (USD million)
- Table 55South Korea: market by country, 2025–2035 (USD million)
- Table 56Australia and New Zealand: market by trade type, 2025–2035 (USD million)
- Table 57Australia and New Zealand: market by trade, 2025–2035 (USD million)
- Table 58Australia and New Zealand: market by channel, 2025–2035 (USD million)
- Table 59Australia and New Zealand: market by buyer, 2025–2035 (USD million)
- Table 60Australia and New Zealand: market by country, 2025–2035 (USD million)
- Table 61Rest of Asia Pacific: market by trade type, 2025–2035 (USD million)
- Table 62Rest of Asia Pacific: market by trade, 2025–2035 (USD million)
- Table 63Rest of Asia Pacific: market by channel, 2025–2035 (USD million)
- Table 64Rest of Asia Pacific: market by buyer, 2025–2035 (USD million)
- Table 65Rest of Asia Pacific: market by country, 2025–2035 (USD million)
- Table 66Company market shares, 2025
- Table 67Scenario values, 2035
- Table 68Sources and confidence grades by figure
FList of figures11
- Figure 1Market value, 2025–2035
- Figure 2Growth decomposition, 2026–2035
- Figure 3Share by trade type, 2025 and 2035
- Figure 4Share by trade, 2025 and 2035
- Figure 5Share by channel, 2025 and 2035
- Figure 6Share by buyer, 2025 and 2035
- Figure 7Share by country, 2025 and 2035
- Figure 8Share by region, 2025 and 2035
- Figure 9Growth by region, 2026–2035
- Figure 10Market concentration, 2025
- Figure 11Scenario paths to 2035
Questions buyers ask
How big is the Asia Pacific retail and wholesale market in 2025 and 2035?
USD 34.10 trillion in 2025, USD 10.09 trillion of retail and USD 24.01 trillion of wholesale, rising to USD 54.21 trillion by 2035 at a 4.74% revenue CAGR.
Which trade type is largest in Asia Pacific?
25.3% of 2025 value, about USD 8.64 trillion, comes from wholesale of machinery, vehicles and electronics; online retail grows fastest at 7.6% a year.
Which country sells the most?
68.4% of 2025 value, about USD 23.33 trillion, is in China; India grows fastest at 9.4% a year to USD 4.54 trillion by 2035.
How fast did China's retail sales grow in 2026?
1.1% in the first nine months of 2026, to CNY 37,000.1 billion, against 3.7% for 2025, per the National Bureau of Statistics.
What did India's GST 2.0 change?
Two main rates, 5% and 18%, plus 40% for a few goods, from 22 September 2025, replacing four rates.
Who leads Asia Pacific retail and wholesale trade?
About 0.42% of 2025 value sits with JD.com, a Douglas Insights estimate, ahead of AEON at 0.21% and Woolworths Group at 0.14%.
How much was China's consumer trade-in subsidy?
CNY 300 billion in 2025, linked to over CNY 2.6 trillion of sales, and CNY 250 billion in 2026.
How far apart are the slower and faster 2035 cases?
USD 43.70 trillion in the slower case and USD 65.18 trillion in the faster case, against a USD 54.21 trillion base.
Research & citation
This report was researched, written and reviewed by the Douglas Insights Research Desk under the Douglas Insights editorial standards. Material errors are logged in the corrections log. No section is sponsored.
Douglas Insights Inc (2026). Asia Pacific Retail and Wholesale Market. Report DI-CG-10893, November 2026. https://www.douglasinsights.com/asia-pacific-retail-and-wholesale-market/